Onboarding guide · Chapter 12
Write a flood report
Commercial · admin or editor
- In an area, open the Report tab and press + New report.
- Under Choose message type, pick one of your message levels. It fills the summary and recommended actions with your defaults. Or choose Custom report for a one-off document with no level or number.
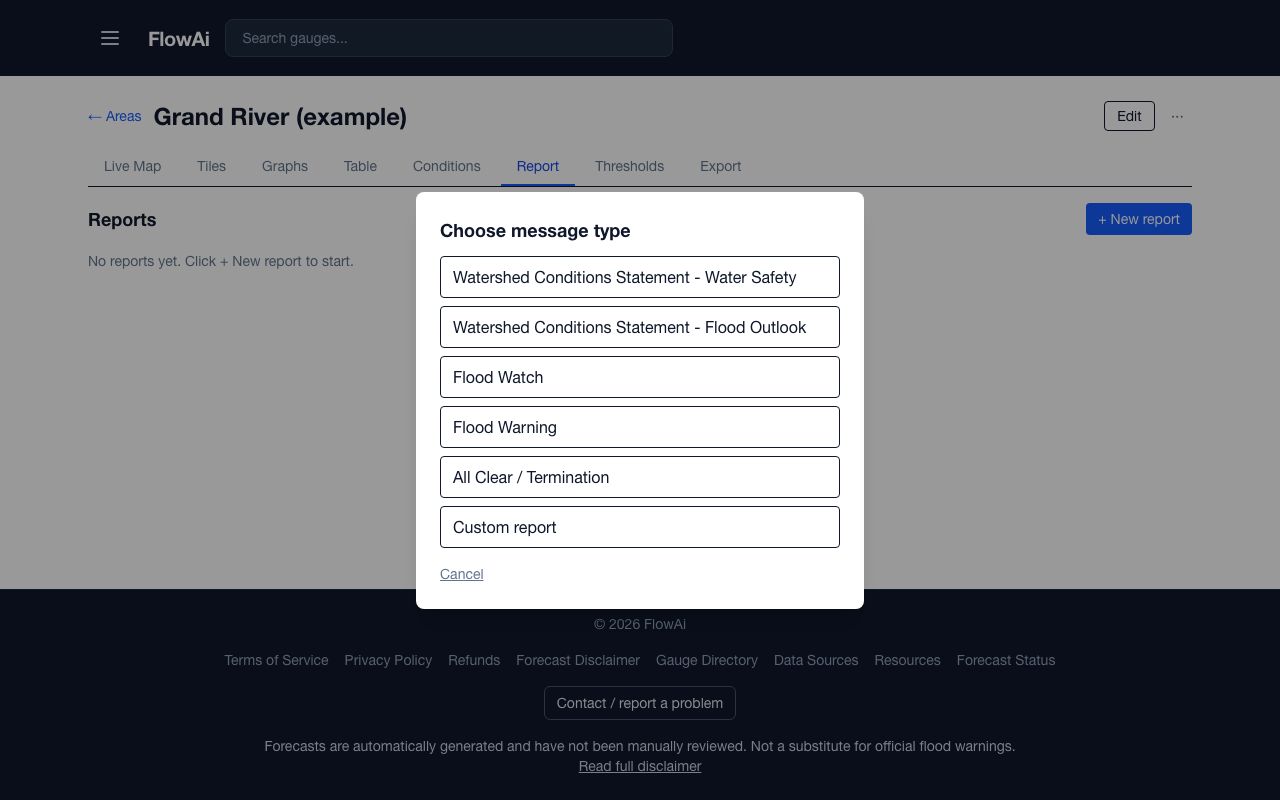
Choose message type. - Fill in the header: Valid until, Next update, Issuing officer and Title. Tick the Hazards that apply (ice, snowmelt, heavy rain, dam operations) and press Add their advice to Recommended actions.
- Under Affected area, pick the municipalities, sub-watersheds and road crossings at risk.
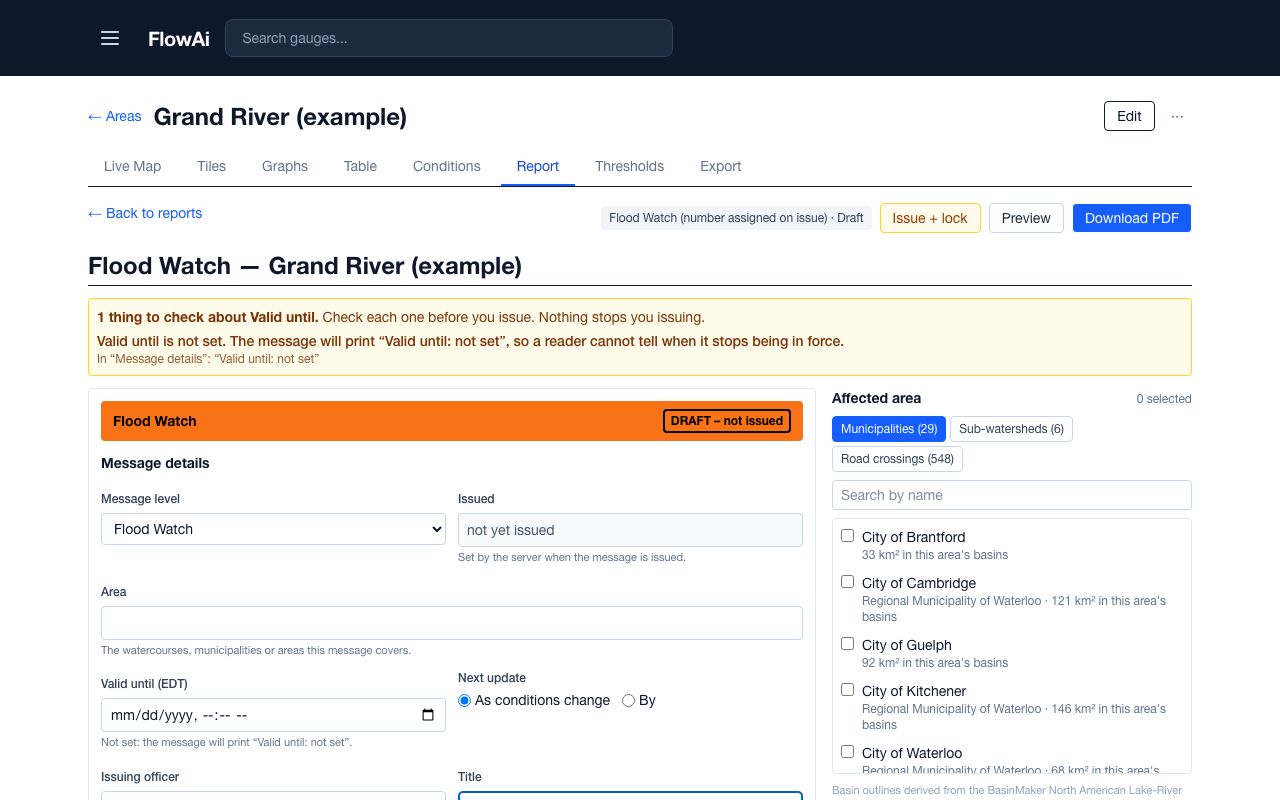
A draft Flood Watch: header on the left, affected area and widgets on the right. - In Current conditions, press Insert latest readings; in Forecast, Insert latest forecast; in Weather forecast, Insert latest weather forecast. Choose the gauges and press Insert: one sentence per gauge goes in as ordinary text you can edit. It replaces the section's text, and Ctrl+Z (⌘Z) undoes it.
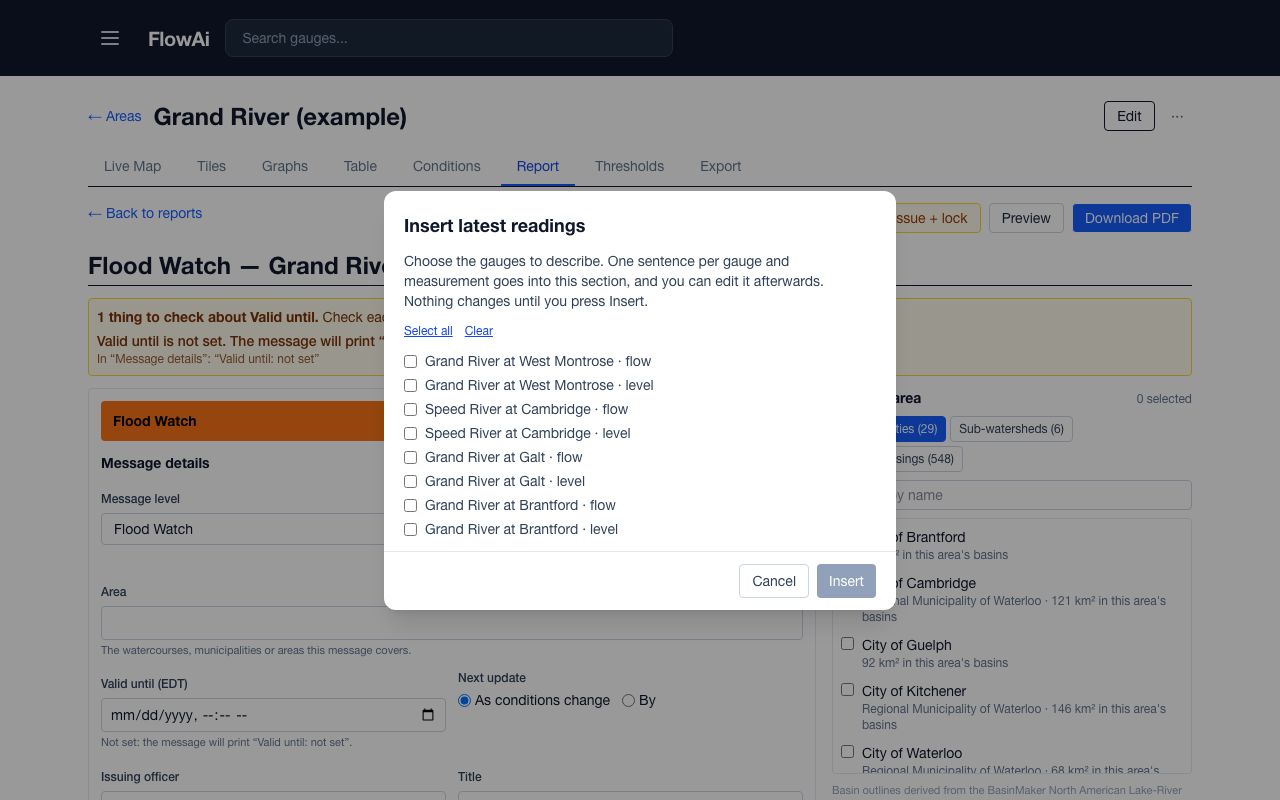
Insert latest readings: pick gauges and measurements. 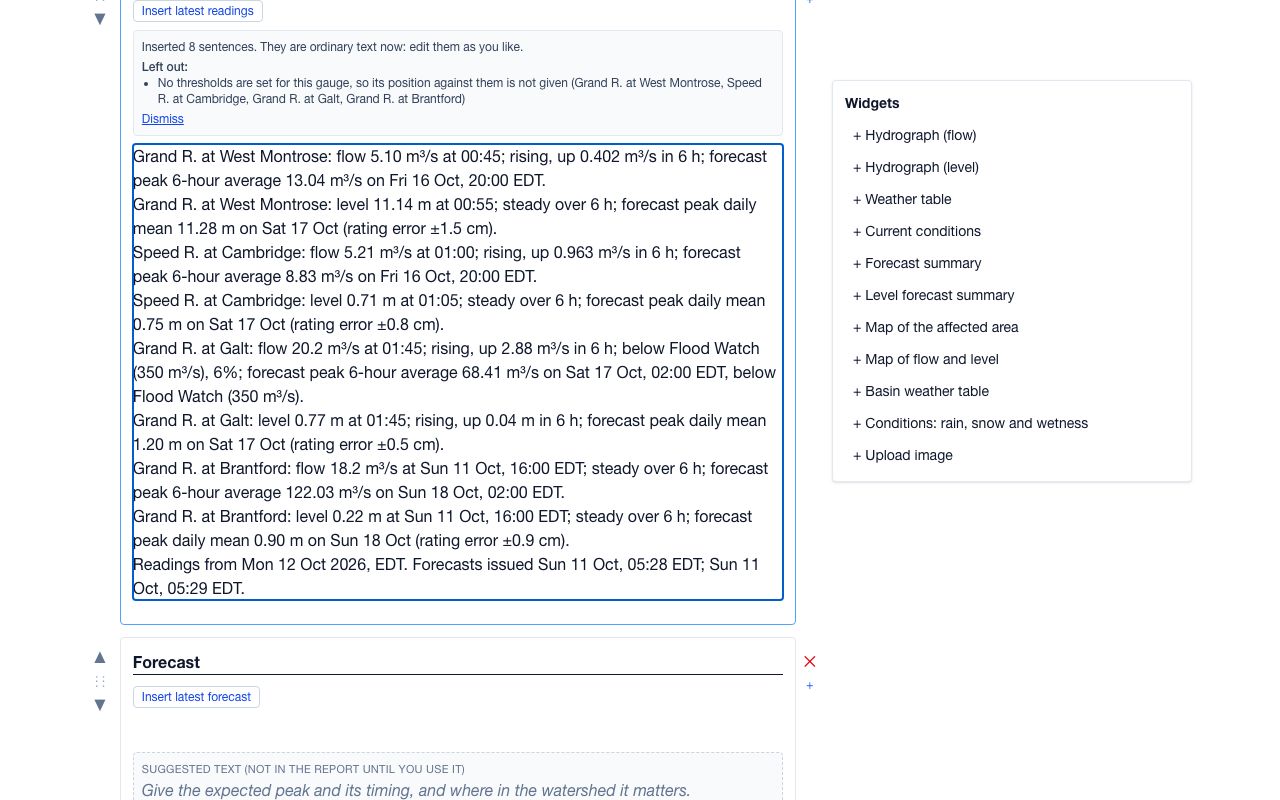
The inserted sentences, now ordinary text you can edit. - Edit the text of each section. Rename, reorder, add or remove sections as you need.
Widgets
Click a section, then pick from Widgets to add live tables, charts and maps to it:
- + Hydrograph (flow, level or inflow), with the median band, your thresholds and 6-hourly or daily values.
- + Current conditions and + Forecast summary: each gauge against your thresholds, and the forecast by lead day with its peak.
- + Level forecast summary, + Weather table, + Basin weather table and + Conditions: rain, snow and wetness.
- + Map of the affected area and + Map of flow and level.
- + Upload image, which adds an image from a web address, with a description for screen readers.
Press Preview to see the PDF as it will print, and Download PDF to save it.