Connect with the API
Read FlowAi observations and forecasts from your own scripts, spreadsheets or dashboards: the same data the FlowAi website shows, as JSON. This guide covers the key, the endpoints, and working sample scripts in Python and R.
1. Create an API key
In Profile › Integrations, name the key after what will use it (for example “Python dashboard”) and choose Create key. Copy it straight away: it is shown once. Give each script or system its own key, so one can be revoked without stopping the others.
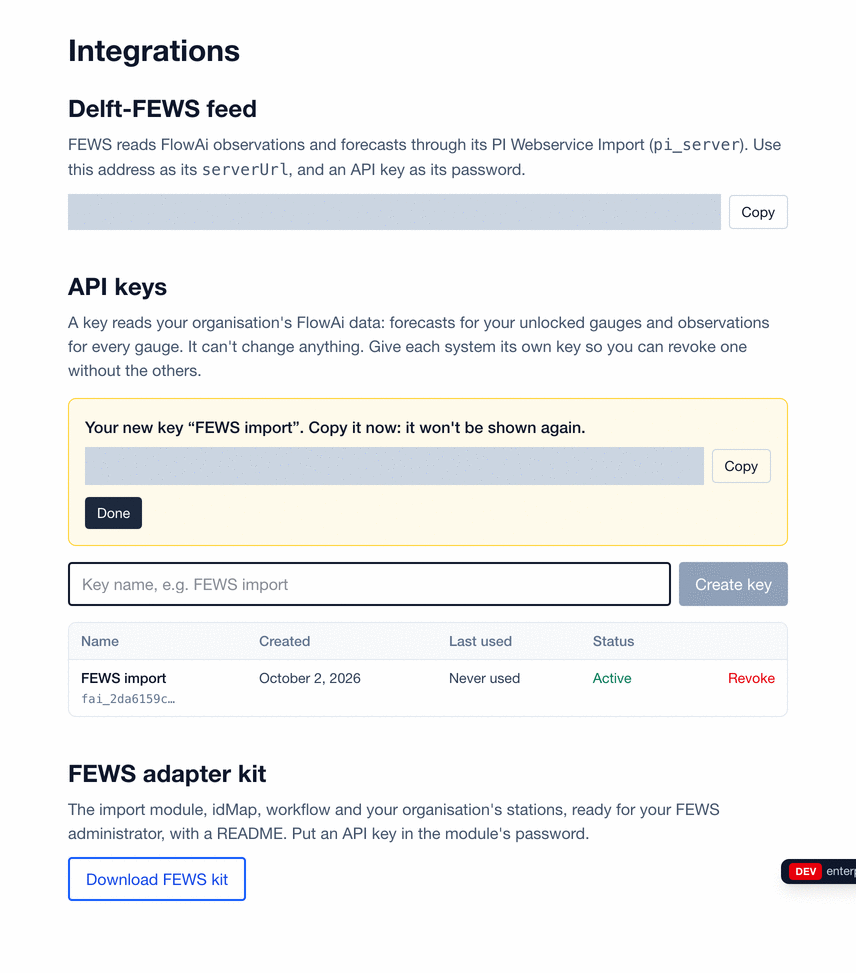
A key reads what your organisation's members read: forecasts for your unlocked gauges (none on other gauges) and observations on any gauge. It can't change anything.
2. Send the key with every request
The API is at https://api.flowai-forecast.com. Send the key in the header Authorization: Bearer fai_…. Keep it out of your code: put it in an environment variable (FLOWAI_API_KEYin the scripts below) or your system's secret store.
curl -H "Authorization: Bearer $FLOWAI_API_KEY" https://api.flowai-forecast.com/api/v1/gauges/02KF019/forecast3. The endpoints
The main ones are below. Every endpoint with all its parameters and response fields is in the API reference.
All are GET. A gauge id is its Water Survey of Canada station id, such as 02KF019.
| Endpoint | Returns |
|---|---|
/api/v1/gauges | The gauge list: {count, gauges: [{id, name, lat, lon, province, ...}]}. Filter with ?q=<name or id> and ?province=ON. |
/api/v1/gauges/{id} | One gauge: name, position, drainage area, whether it has a forecast model, and its model card. |
/api/v1/gauges/{id}/latest | The latest real-time reading: flow_cms, level_m, their timestamps (UTC) and age in minutes, and any quality flag. |
/api/v1/gauges/{id}/recent | Real-time readings of the last hours, oldest first: {flow: [{timestamp, value, flag}], level: [...]}. ?hours=48 (the default). Times are UTC. |
/api/v1/gauges/{id}/observed | Daily observed values, newest first: {readings: [{timestamp, flow_cms, level_m, flag}]}. ?days=7 (default 90, at most the last 2 water years plus the current one, whatever days you ask for; the response says window_start. Single past years: /observed/year/{y}). |
/api/v1/gauges/{id}/forecast | The latest forecast: issue_time and forecasts: [{valid_date, lead_days, flow_cms, segment, ...}]. Use the rows with segment "forecast". The key's plan sets the horizon on your organisation's unlocked gauges (Commercial: 10 days) and sub_daily adds four 6-hour blocks per day ({valid_start, valid_end, flow_cms}) that average to the daily value; it is an empty list for an issue published without blocks. |
/api/v1/gauges/{id}/forecast-history | Past forecast issues for comparing with what happened. ?days=14. |
/api/v1/gauges/{id}/weather-forecast | The basin-average weather forecast, 10 days, public, no key needed: {run_id, issued_at, days: [{valid_date, precip_mm, temp_c, temp_min_c, temp_max_c, precip_cumul_mm}]}. withheld_reason is set, and no weather served, when the gauge's basin outline is implausible. |
/api/v1/gauges/{id}/forcing | Observed basin precipitation and temperature per UTC day: {forcing: [{date, precip_mm, temp_avg, temp_min, temp_max}]}. ?days=90. |
/rest/fewspiservice/v1/timeseries | Many gauges and series in one call, as PI-JSON (documentFormat=PI_JSON) or PI-XML. The Delft-FEWS guide describes the parameters. |
Also available, as on a gauge page: /percentiles (historical flow percentiles by day of year), /model-card (the forecast model and its measured skill), /hindcast and /forecast-verification (past forecasts against what happened), and /observed/year/{year} (one past year, day by day), each under /api/v1/gauges/{id}.
Reading the values
- Units: flow in m³/s (
flow_cms), level in metres (level_m). - Real-time readings (
/latest,/recent, and Q.obs/H.obs in the feed) carry UTC time stamps. - Daily values (
/observed, and the forecast'svalid_date) are labelled by the data provider's calendar day. The day's boundaries follow the provider and are not shifted to UTC. - The forecast:
lead_days0 is the issue day (today), up to 9 on your unlocked gauges (a 10-day forecast). Skip rows whosesegmentiswarmstart: they are the model's run over the past, not a forecast. - Gaps and flags: a value that doesn't exist is
null, never filled in.SUSPECTmarks a value FlowAi's quality control flagged. - Disclaimer: every response to a key carries its link and version in the
X-FlowAi-Disclaimerheader, and every forecast response adisclaimerobject (variant,text,url,version). A Public Agency's key gets the Public Agency version.
Sample scripts
Both scripts do the same thing: print a gauge's latest reading, save its last 7 days of observations and its latest forecast as CSV files, and read two gauges in one call through the feed. They were run against FlowAi before publishing. Set FLOWAI_API_KEY first.
"""FlowAi API example (Python 3.9+, requests): a gauge's latest reading, its observations and forecast as CSV,
and several gauges in one call through the PI-JSON feed.

    pip install requests
    export FLOWAI_API_KEY="fai_..."        # from Profile > Integrations; never put the key in the script
    python flowai_example.py
"""
import csv
import os
import time
from datetime import datetime, timedelta, timezone

import requests

API = os.environ.get("FLOWAI_API_URL", "https://api.flowai-forecast.com")
GAUGE = "02KF019"                       # a WSC station id
GAUGES = ["02KF019", "02HB029"]

session = requests.Session()
session.headers["Authorization"] = f"Bearer {os.environ['FLOWAI_API_KEY']}"


def get(path, params=None):
    """GET a FlowAi URL. On the key's rate limit (HTTP 429), wait as long as Retry-After says, then try once more."""
    r = session.get(f"{API}{path}", params=params, timeout=30)
    if r.status_code == 429:
        time.sleep(int(r.headers.get("Retry-After", "60")))
        r = session.get(f"{API}{path}", params=params, timeout=30)
    r.raise_for_status()
    return r


# 1. The gauge and its latest reading
gauge = get(f"/api/v1/gauges/{GAUGE}").json()
latest = get(f"/api/v1/gauges/{GAUGE}/latest").json()
print(f"{gauge['name']} ({GAUGE}): {latest['flow_cms']} m3/s at {latest['flow_timestamp']}")

# 2. Daily observed flow and level, last 7 days, newest first, to CSV. Each row is the provider's daily value,
#    stamped with its calendar date (00:00). For real-time readings use /recent (the last 48 hours) or the feed (step 4).
observed = get(f"/api/v1/gauges/{GAUGE}/observed", {"days": 7}).json()["readings"]
with open(f"{GAUGE}_observed.csv", "w", newline="") as f:
    w = csv.writer(f)
    w.writerow(["date", "flow_cms", "level_m", "flag"])
    for row in observed:
        w.writerow([row["timestamp"][:10], row["flow_cms"], row["level_m"], row["flag"]])
print(f"{len(observed)} days observed -> {GAUGE}_observed.csv")

# 3. The latest forecast, one row per day, to CSV
forecast = get(f"/api/v1/gauges/{GAUGE}/forecast").json()
days = [lead for lead in forecast["forecasts"] if lead["segment"] == "forecast"]
with open(f"{GAUGE}_forecast.csv", "w", newline="") as f:
    w = csv.writer(f)
    w.writerow(["issue_time_utc", "valid_date", "lead_days", "flow_cms"])
    for lead in days:
        w.writerow([forecast["issue_time"], lead["valid_date"], lead["lead_days"], lead["flow_cms"]])
print(f"forecast issued {forecast['issue_time']}: {len(days)} days -> {GAUGE}_forecast.csv")

# 4. Several gauges and series in one call: the PI-JSON feed
now = datetime.now(timezone.utc)
params = [("locationIds", g) for g in GAUGES] + [("parameterIds", p) for p in ("Q.obs", "Q.fcst.day")]
params += [("startTime", (now - timedelta(days=2)).strftime("%Y-%m-%dT%H:%M:%SZ")),
           ("endTime", (now + timedelta(days=11)).strftime("%Y-%m-%dT%H:%M:%SZ")),
           ("documentFormat", "PI_JSON")]
feed = get("/rest/fewspiservice/v1/timeseries", params)
for series in feed.json()["timeSeries"]:
    h, events = series["header"], series["events"]
    last = f"{events[-1]['date']} {events[-1]['time']} = {events[-1]['value']}" if events else "no values"
    print(f"{h['locationId']} {h['parameterId']}: {len(events)} values, last {last}")
print(feed.headers["X-FlowAi-Disclaimer"])
# FlowAi API example (R 4.1+, httr2): a gauge's latest reading, its observations and forecast as CSV,
# and several gauges in one call through the PI-JSON feed.
#
#   install.packages(c("httr2", "jsonlite"))
#   Sys.setenv(FLOWAI_API_KEY = "fai_...")   # from Profile > Integrations; better in ~/.Renviron than in the script
#   source("flowai_example.R")

library(httr2)

api <- Sys.getenv("FLOWAI_API_URL", "https://api.flowai-forecast.com")
gauge_id <- "02KF019"                       # a WSC station id
gauge_ids <- c("02KF019", "02HB029")

# GET a FlowAi URL with the key; waits and retries when the key's rate limit (HTTP 429) is reached.
flowai_get <- function(path, query = list()) {
  request(api) |>
    req_url_path_append(path) |>
    req_url_query(!!!query, .multi = "explode") |>
    req_auth_bearer_token(Sys.getenv("FLOWAI_API_KEY")) |>
    req_retry(max_tries = 2, is_transient = \(resp) resp_status(resp) == 429) |>
    req_timeout(30) |>
    req_perform()
}

# 1. The gauge and its latest reading
gauge <- flowai_get(paste0("api/v1/gauges/", gauge_id)) |> resp_body_json()
latest <- flowai_get(paste0("api/v1/gauges/", gauge_id, "/latest")) |> resp_body_json()
cat(sprintf("%s (%s): %s m3/s at %s\n", gauge$name, gauge_id, latest$flow_cms, latest$flow_timestamp))

# 2. Daily observed flow and level, last 7 days, newest first, to CSV. Each row is the provider's daily value,
#    stamped with its calendar date (00:00). For real-time readings use /recent (the last 48 hours) or the feed (step 4).
#    A missing value (JSON null) becomes NA.
observed <- flowai_get(paste0("api/v1/gauges/", gauge_id, "/observed"), list(days = 7)) |>
  resp_body_json(simplifyVector = TRUE)
readings <- observed$readings[, c("timestamp", "flow_cms", "level_m", "flag")]
readings$timestamp <- substr(readings$timestamp, 1, 10)
names(readings)[1] <- "date"
write.csv(readings, paste0(gauge_id, "_observed.csv"), row.names = FALSE)
cat(nrow(readings), "days observed ->", paste0(gauge_id, "_observed.csv\n"))

# 3. The latest forecast, one row per day, to CSV
forecast <- flowai_get(paste0("api/v1/gauges/", gauge_id, "/forecast")) |> resp_body_json(simplifyVector = TRUE)
days <- subset(forecast$forecasts, segment == "forecast", select = c(valid_date, lead_days, flow_cms))
days <- cbind(issue_time_utc = forecast$issue_time, days)
write.csv(days, paste0(gauge_id, "_forecast.csv"), row.names = FALSE)
cat(sprintf("forecast issued %s: %d days -> %s_forecast.csv\n", forecast$issue_time, nrow(days), gauge_id))

# 4. Several gauges and series in one call: the PI-JSON feed
now <- Sys.time()
utc <- \(t) format(t, "%Y-%m-%dT%H:%M:%SZ", tz = "UTC")
feed <- flowai_get("rest/fewspiservice/v1/timeseries", list(
  locationIds = gauge_ids, parameterIds = c("Q.obs", "Q.fcst.day"),
  startTime = utc(now - 2 * 86400), endTime = utc(now + 11 * 86400), documentFormat = "PI_JSON"))
for (series in resp_body_json(feed)$timeSeries) {
  n <- length(series$events)
  last <- if (n > 0) with(series$events[[n]], paste(date, time, "=", value)) else "no values"
  cat(sprintf("%s %s: %d values, last %s\n", series$header$locationId, series$header$parameterId, n, last))
}
cat(resp_header(feed, "X-FlowAi-Disclaimer"), "\n")
What either prints (sandbox data, 2 October 2026):
Mississippi River at Outlet of Dalhousie (02KF019): 6.851 m3/s at 2026-10-02T17:30:00Z
6 days observed -> 02KF019_observed.csv
forecast issued 2026-10-02T00:00:00Z: 10 days -> 02KF019_forecast.csv
02KF019 Q.obs: 179 values, last 2026-10-02 17:30:00 = 6.851
02KF019 Q.fcst.day: 10 values, last 2026-10-12 00:00:00 = 6.381788
...
https://flowai-forecast.com/disclaimer; version=2026-10-10
Limits and errors
Each key may make 60 requests a minute and 10,000 a day. A script that refreshes hourly uses a tiny part of it; fetch several gauges per call with the feed rather than one call per gauge per minute.
| Status | Detail | What it means |
|---|---|---|
| 401 | invalid_api_key | The key is wrong, incomplete or revoked. |
| 403 | integration_required | Your organisation does not hold the Data Integration package (or it has ended). Keys stop working at once. You can ask to test the API: email [email protected]. |
| 404 | Gauge not found | No gauge with that id. Look it up with /api/v1/gauges?q=. |
| 429 | api_key_rate_limited | More than 60 requests a minute or 10,000 a day on this key. Wait for the seconds in the Retry-After header; both scripts do. |
Data sources and attribution
FlowAi's forecasts are built on public data. When you republish values you got from FlowAi, credit those sources as their licences ask. A gauge's statements are in its attribution (/gauges, /gauges/{id}), with the provider in data_provider; print them with that gauge's observations. For example:
- Water Survey of Canada stations (
data_providerwscorwsc_direct): “Data Source: Environment and Climate Change Canada (Water Survey of Canada; Meteorological Service of Canada: HRDPS, GDPS, HRDPA/CaPA). Contains information licensed under the Open Government Licence – Canada and the Environment and Climate Change Canada Data Servers End-use Licence.” and, for a station read through Ontario's feed (wsc), the Ontario Surface Water Monitoring Centre's line below. A station outside Ontario that FlowAi reads from ECCC itself (wsc_direct) carries the first statement only. - Provincial stations: “Contains information provided by the Ontario Surface Water Monitoring Centre, Ministry of Natural Resources.”
- Weather forecasts and observed precipitation: the Environment and Climate Change Canada statement above.
- Observed basin temperature (
/forcing): “Contains modified Copernicus Climate Change Service information 2026.”
The full list is on Data Sources. These credits are for the original data; none of them suggests that the source endorses FlowAi or your use.
Disclaimer
FlowAi forecasts are for information only and may be inaccurate. They are not official flood warnings. Read the Forecast Disclaimer (for a Public Agency, its Public Agency version) and the Terms of Service.