Onboarding guide · Chapter 2
Read a gauge page
Everyone; the forecast needs an unlocked gauge
A gauge page is one scrolling page. From the top:
- Readings. Latest flow, Forecast peak flow, Latest level, Forecast peak level (where the gauge has a level forecast) and Latest water temperature, each with its time. The ⓘ beside a peak gives the forecast's issue time.
- The chart. Observed daily means, the last 48 hours of readings, the forecast, and the shaded Normal range. The default view is the last 7 days plus the forecast. Scroll or pinch to zoom, drag to pan, Shift+drag to zoom to a box, and Reset zoom to return.
- Chart controls. 6-hourly | Daily switches the forecast between 6-hour blocks and daily means. Year overlay draws any year back to 1996. Past forecasts draws earlier issues as dashed purple lines, so you can see how the forecast has moved. Show all thresholdsdraws your organisation's lines.
- Rain, snow and wetness. Observed and forecast rain, snowpack and how wet the basin is.
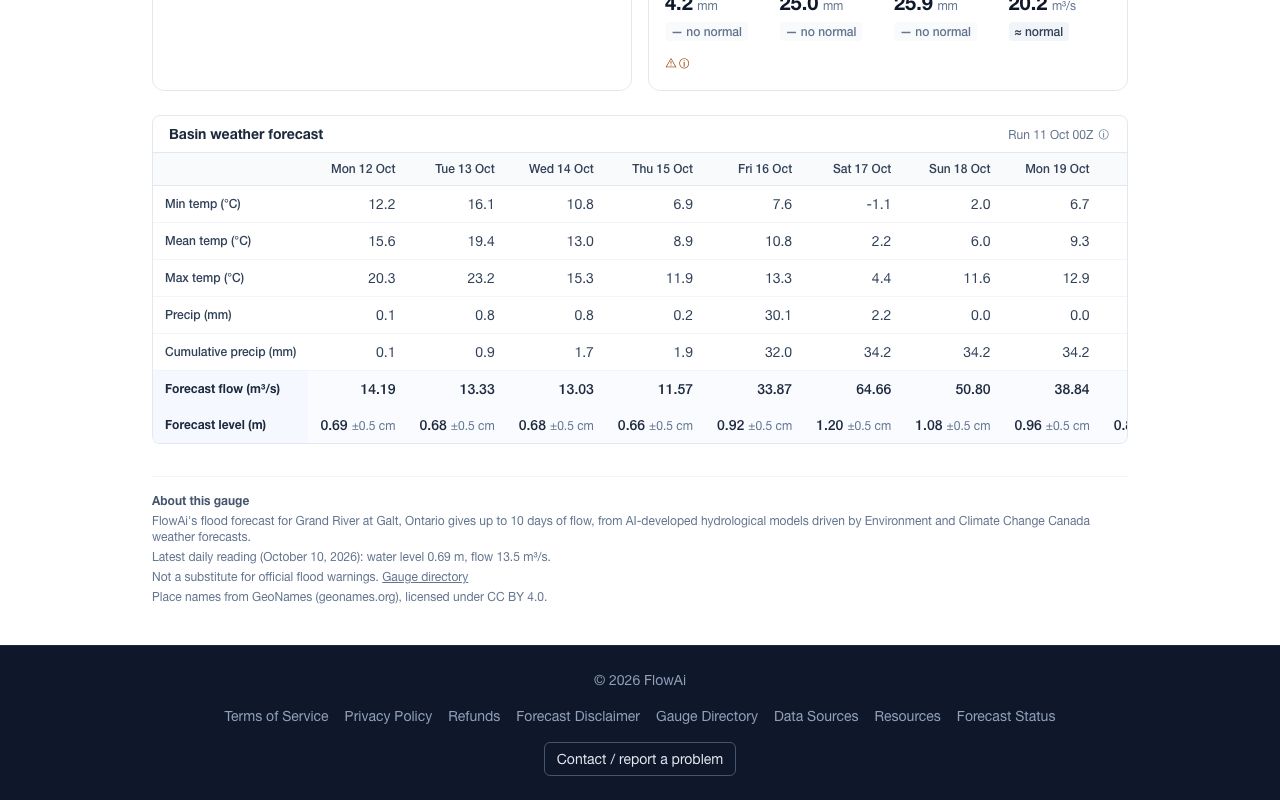
- Basin weather forecast. 10 days of temperature and precipitation averaged over the basin, with Forecast flow (m³/s) and Forecast level (m) rows.
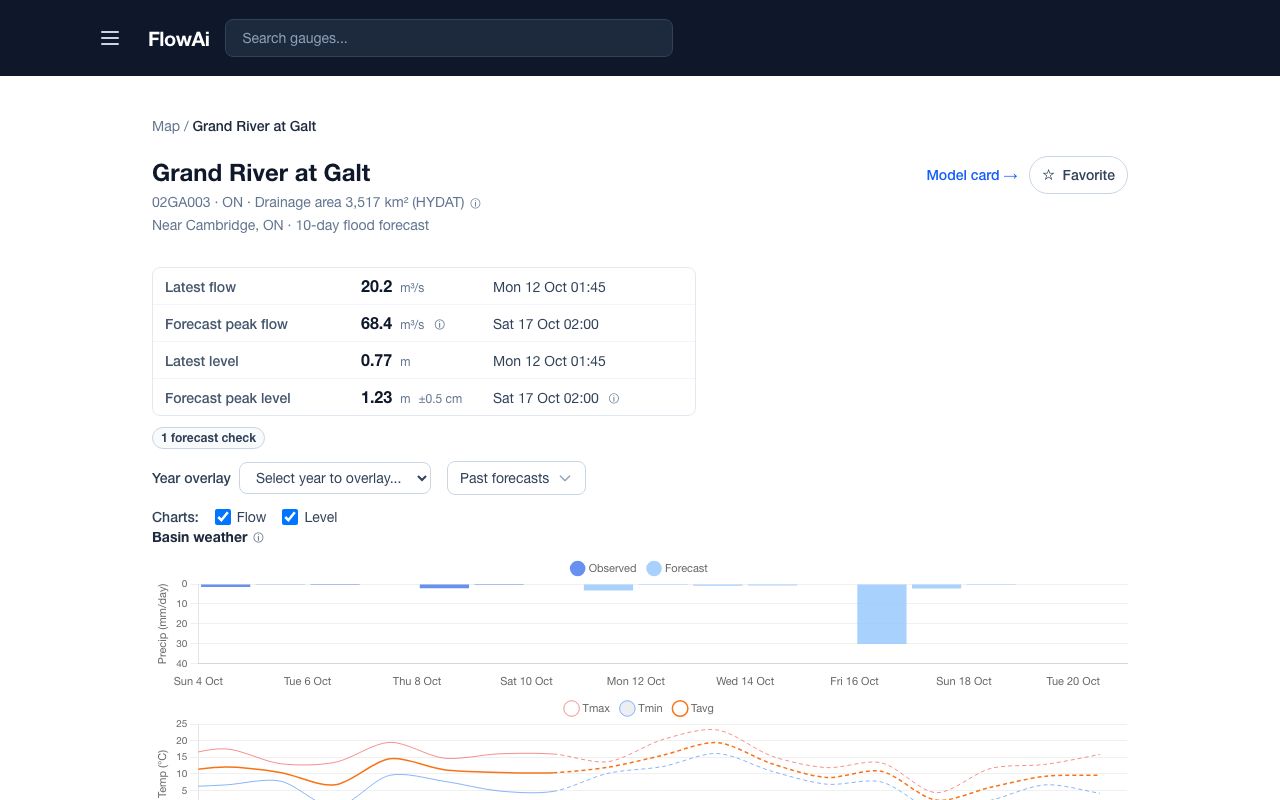
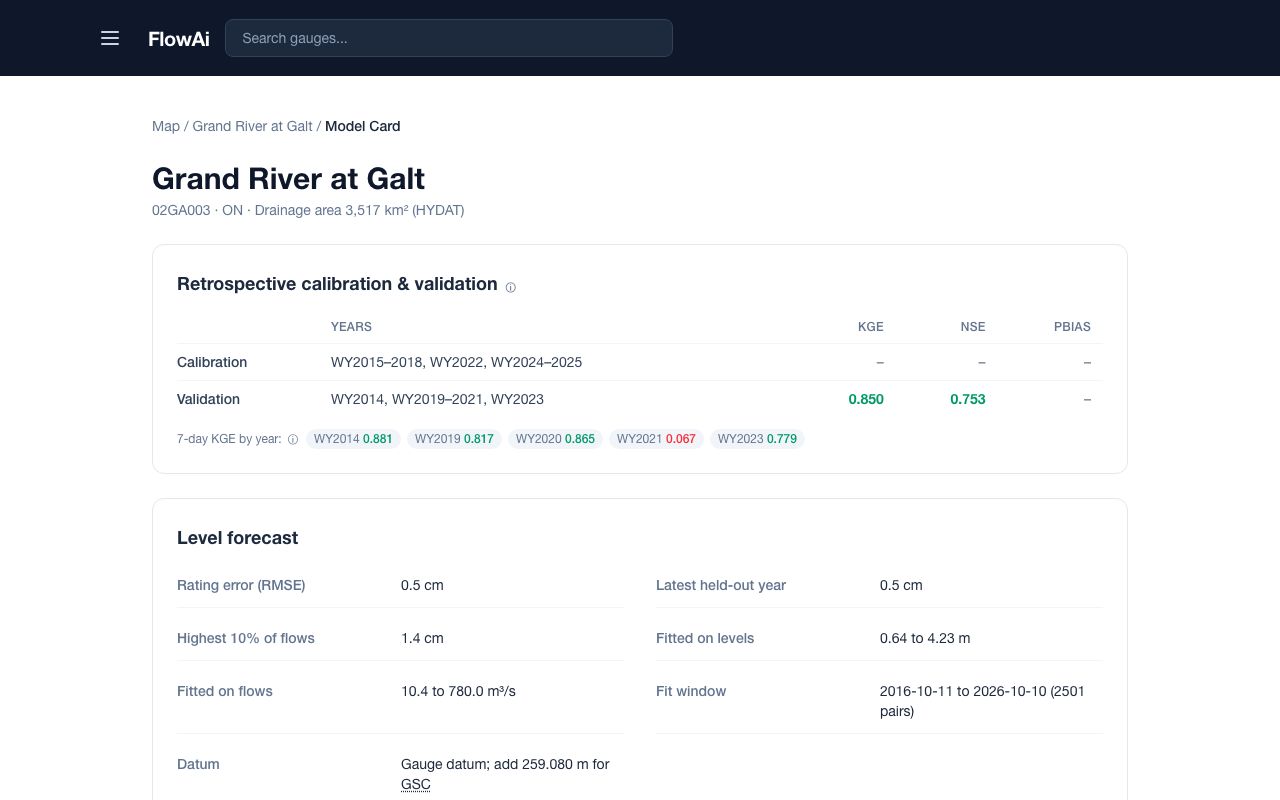
Model card →at the top shows how well this gauge's model scored on years it was not fitted to, and its limits. Read it before relying on a gauge for decisions. A Commercial organisation sees the full card, with NSE, percent bias and year-by-year results.
A chip such as 🔒 Unlockbeside the forecast peak means your organisation hasn't unlocked this gauge yet. See chapter 7.