Onboarding guide · Chapter 9
Set thresholds and threshold emails
Commercial · admin or editor
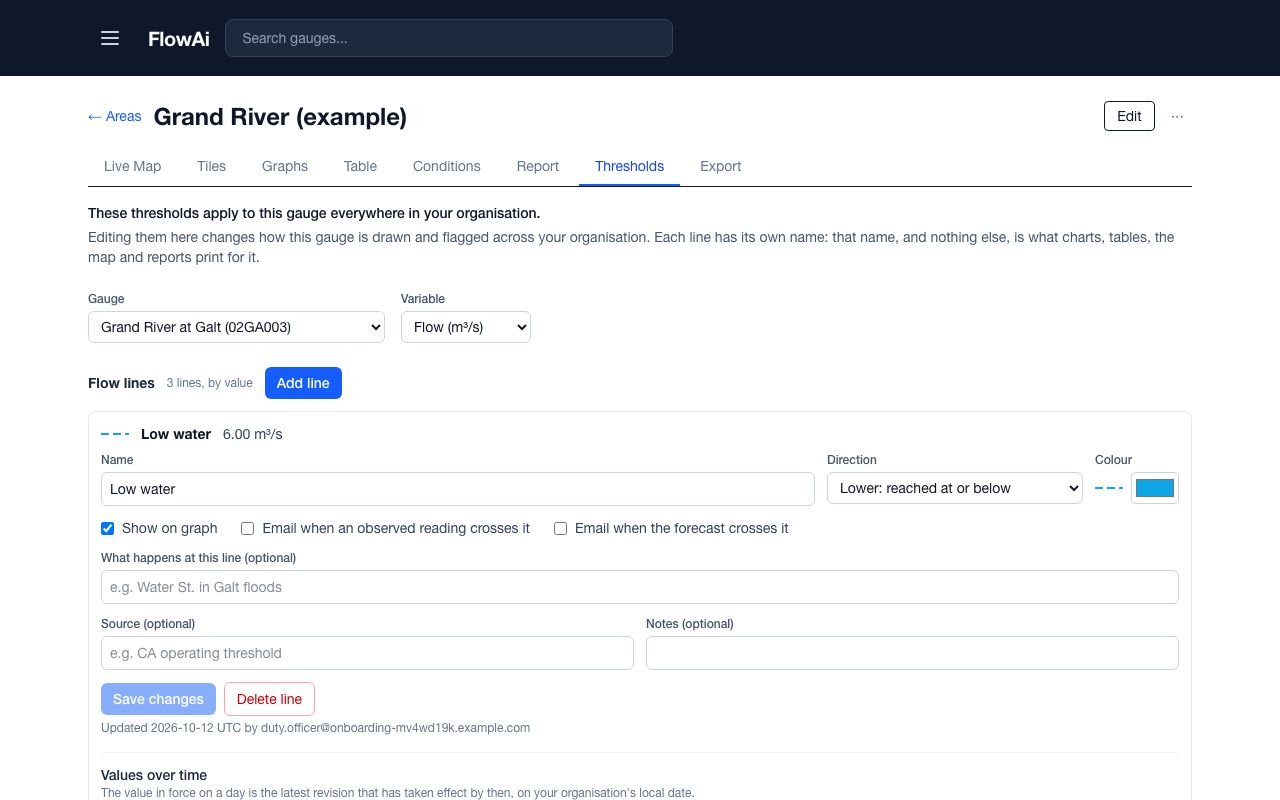
A threshold line is a named flow or level for one gauge, such as “Flood Watch” or “Low water”. It applies to that gauge everywhere in your organisation: charts, tiles, the map, report tables and emails.
- In an area, open the Thresholds tab and pick the Gauge and the Variable (flow, level or inflow).
- Press Add line and give it a Name. The name is what charts, tables and reports print.
- Pick a Direction: Upper (reached at or above), Lower (reached at or below), or Reference (drawn only, no status or email).
- Enter the value. Levels are metres above the gauge datum; you can record the datum and a source and notes with the line.
- Tick Show on graph, and Email when an observed reading crosses it and/or Email when the forecast crosses it to email your organisation's members.
- Press Add line. A preview chart shows the line against the gauge's record.
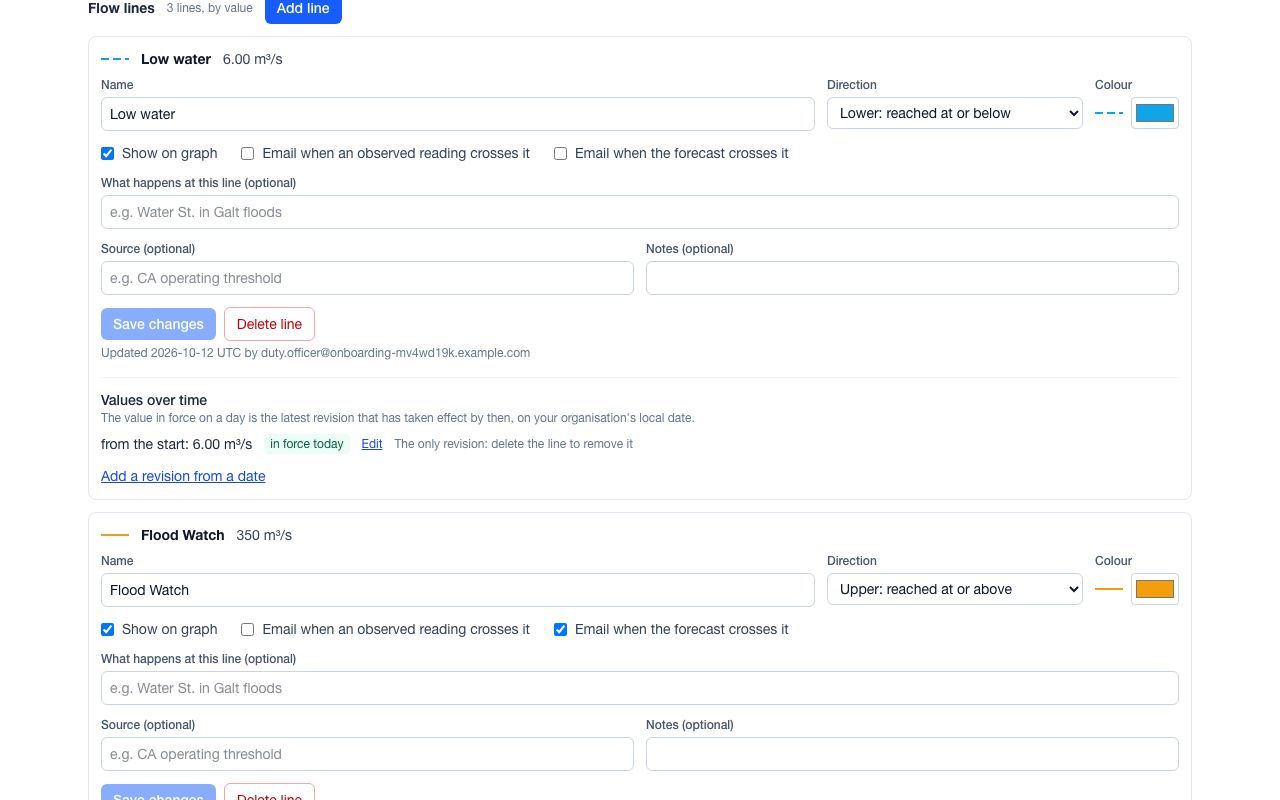
Seasonal values and revisions
Switch Single value | Seasonal to Seasonal for a line that changes through the year. Enter dates and values, paste them from a spreadsheet or load a CSV; choose Linear or Step between points. To change a line from a date without losing its history, use Add a revision from a date.
Where to start
If you have no official values yet, the FlowAi estimate (not an official threshold) panel gives return-period flows for the gauge. Start a new line from it fills in a line you can adjust.
Who gets threshold emails: every member, unless they turn off Email me when my organisation's thresholds are crossed in Profile › Notifications. A forecast email for a level line uses the daily-mean level forecast.