Onboarding guide · Chapter 8
Build an area for your watershed
Commercial
An area is your organisation's own group of gauges: a watershed, a town, a set of sites. Everyone in the organisation sees it, and it is where thresholds, exports and reports live.
- Open Areas from the menu, type a name such as “Grand River watershed” and press Create your first area (later, + New area).
- In the area, press Edit, then + Add gauge. Search or click gauges on the map; for each, tick the signals you want (flow, level, natural or total inflow, temperature). Press Add … signals to area.
- Press Reorder to put gauges in upstream-to-downstream order. That order is used on every tab and in reports.
- Press Done. Rename or delete the area from the ··· menu.
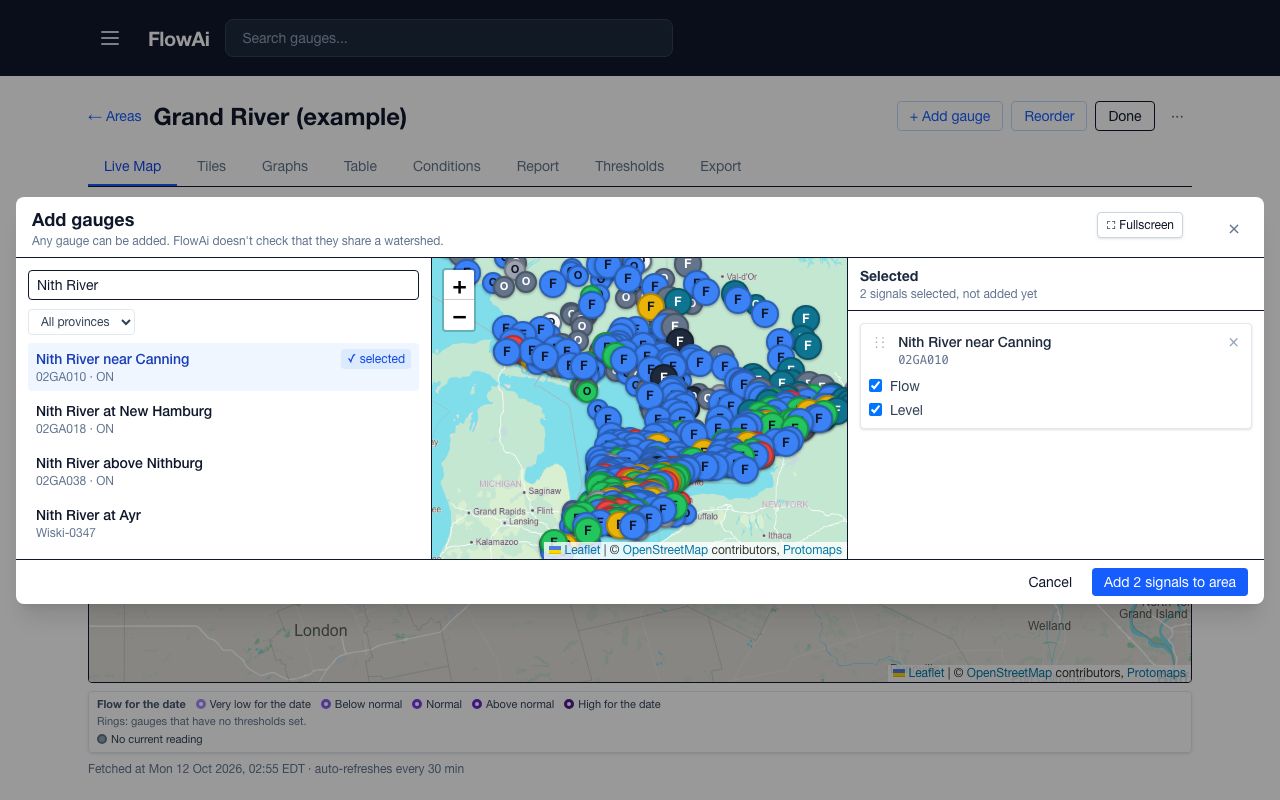
The area tabs
| Tab | What it is for |
|---|---|
| Live Map | The area's gauges on a map, coloured by flow status. Refreshes every 30 minutes. |
| Tiles | One tile per gauge: the latest readings and where they sit against your thresholds. |
| Graphs | A hydrograph per gauge, with a synced year overlay and the median or P10–P90 band. |
| Table | The basin weather forecast for each gauge, with forecast flow and level rows. |
| Conditions | Rain over the last and next 24, 48 and 72 hours, snowpack and wetness, one row per gauge. |
| Report | Your flood reports for this area (chapters 12 and 13). |
| Thresholds | Your organisation's lines for each gauge (chapter 9). |
| Export | CSV or PDF downloads of observed data or the latest forecast (chapter 10). |
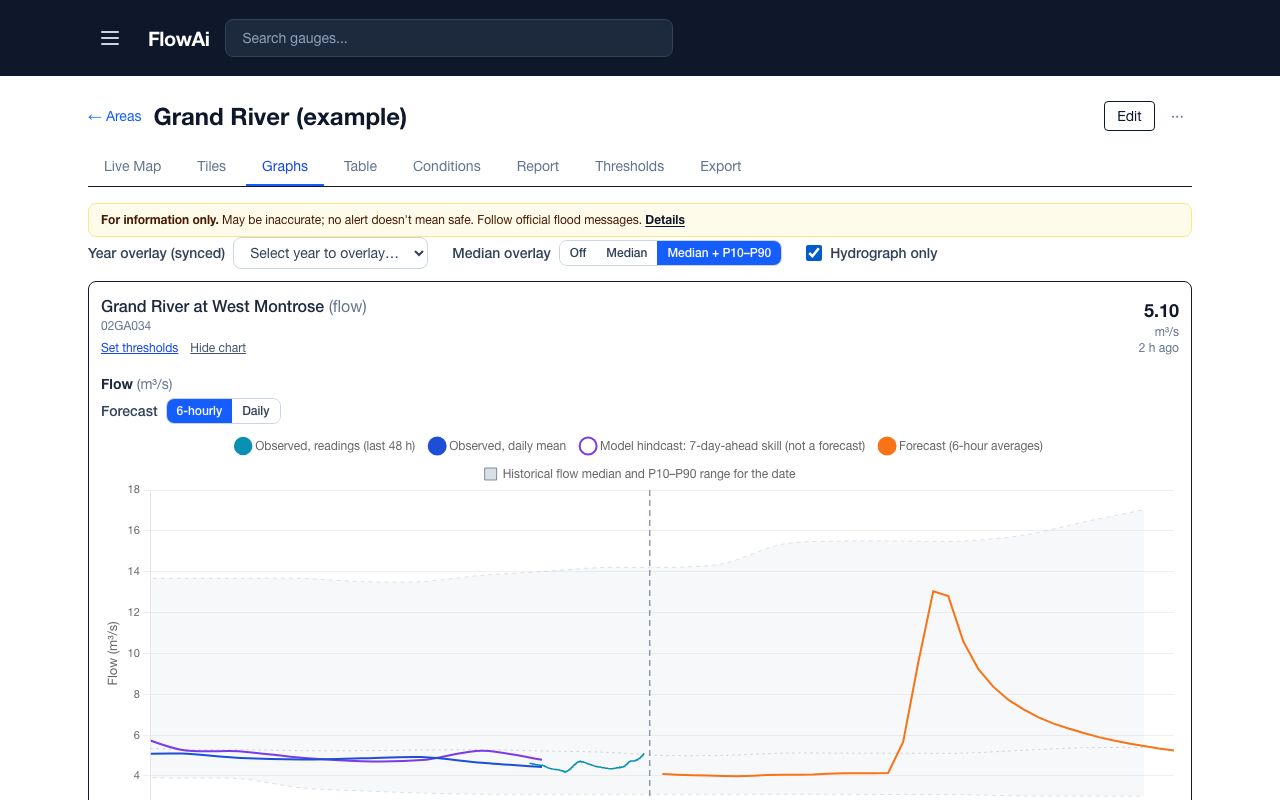
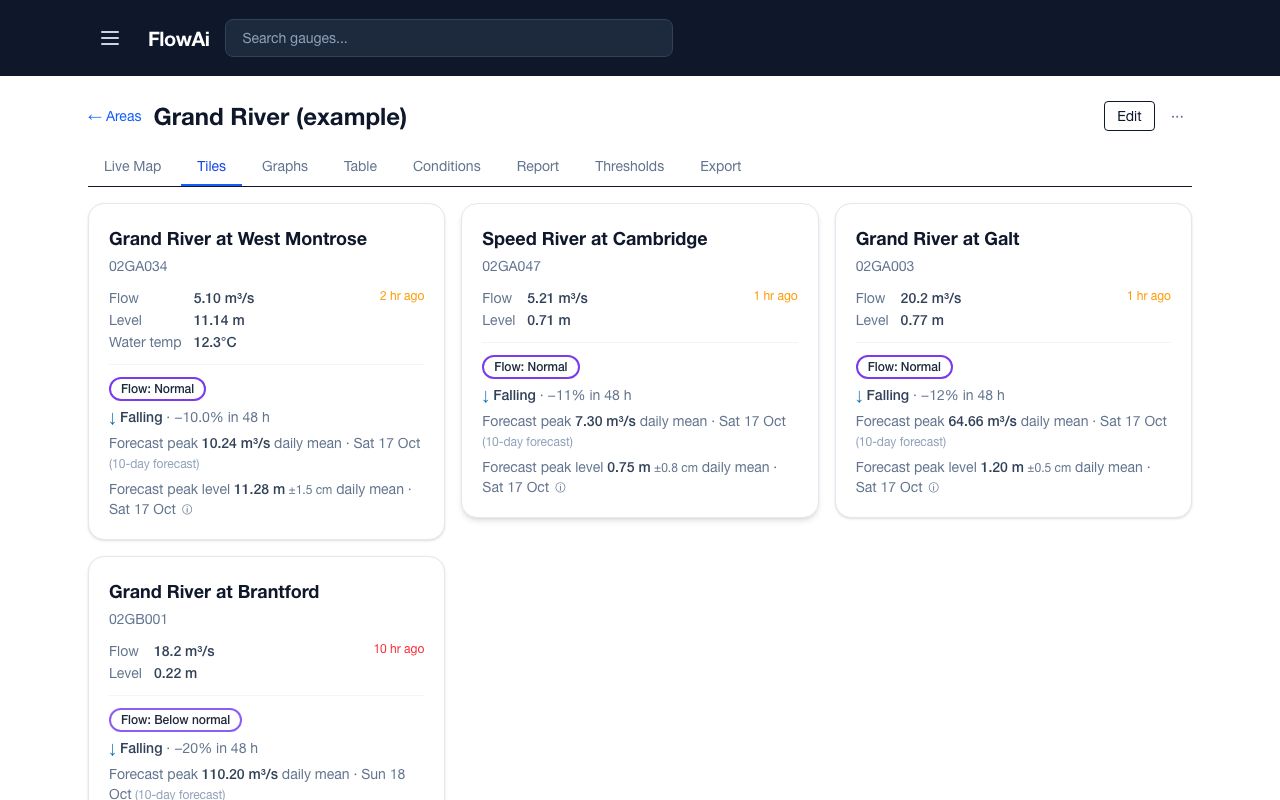
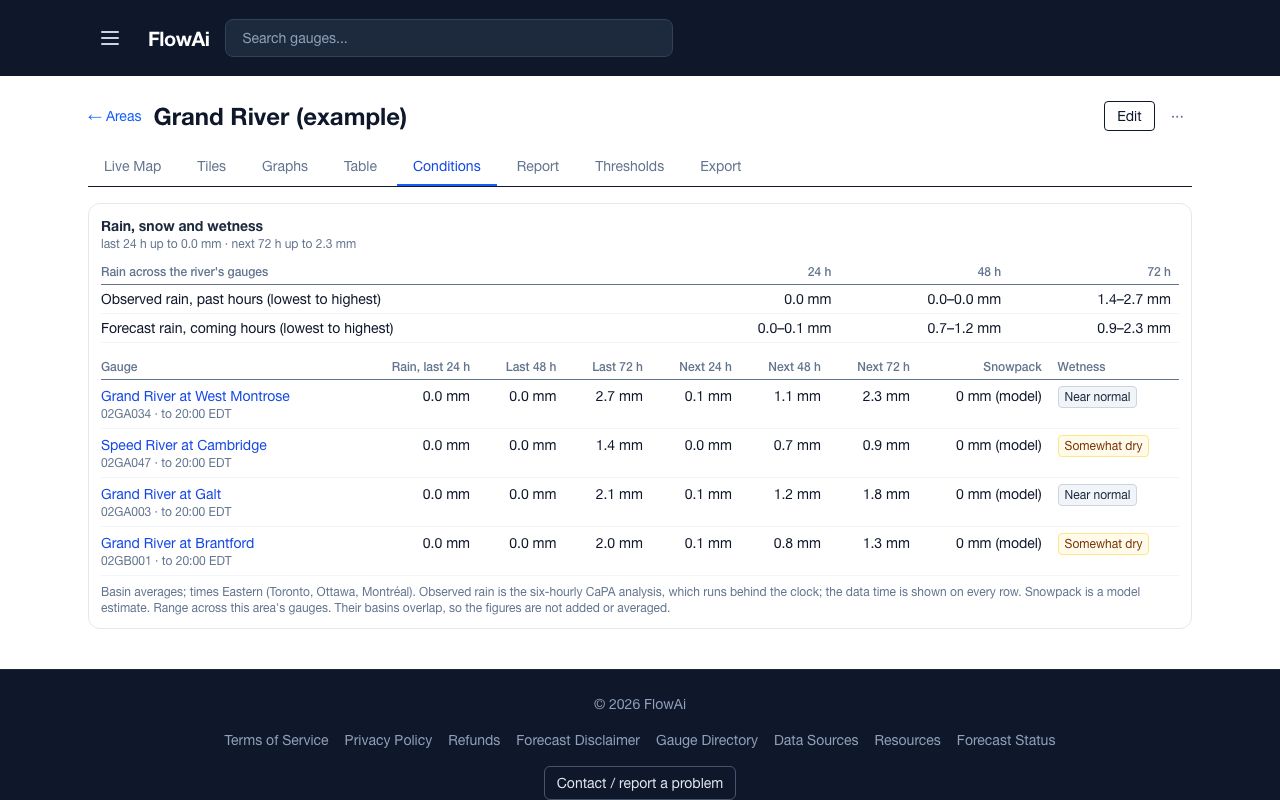
The tab is part of the address, so you can bookmark or share a link straight to an area's Graphs or Report tab with a colleague. The first time you open a forecast tab, press Accept and show forecasts to accept the Terms and forecast disclaimer.
An area with issued messages can't be deleted, only archived. An archived area is read-only; an admin can restore it from Show archived.